
FRET has become one of the most widely used applications for measuring the clustering of proteins in biological systems. Since FRET is manifested in many measurable changes, a lot of different approaches have been established to analyze protein clustering based on FRET. If you are interested in the principles of FRET and you would like to get a brief introduction to many of the methods used to measure it, you can find resources below.
One of the easiest ways to measure FRET is a ratiometric or intensity-based experiment in which a sample labeled with donor and acceptor fluorophores is measured in three fluorescence channels:
I have written a Matlab application, rFRET, which evaluates such an experiment using different approaches:
Syntax: rfret
Registration: a machine specific code is shown when running the program for the first time which you have to send to peter.v.nagy@gmail.com. I will send you a machine-specific unlock code free of charge.
Installation: download rfret.zip,
unzip it into a folder on your machine and type rfret at the Matlab
command prompt after changing the current folder to the one you
installed rFRET into. Alternatively, add the folder to the search path
of Matlab.
Help: the Help file also available from within the application.
Sample images:
a set of images is available for practicing using the program. The ZIP file contains four folders:
Updating: the program will automatically check for and download upgrades.


Fluorescence emitted by fluorophores does not increase linearly with excitation intensity. This phenomenon is called fluorophore saturation. The figure below shows the effect of fluorophore saturation on the emitted fluorescence. Since the photon fluxes shown on the horizontal scale are achieved in regular confocal microscopy, fluorophore saturation takes place under conditions commonly used in microscopy. A photon flux of 1E24 1/(cm2 s), is achieved at 15% laser power on our Zeiss LSM810 microscope.

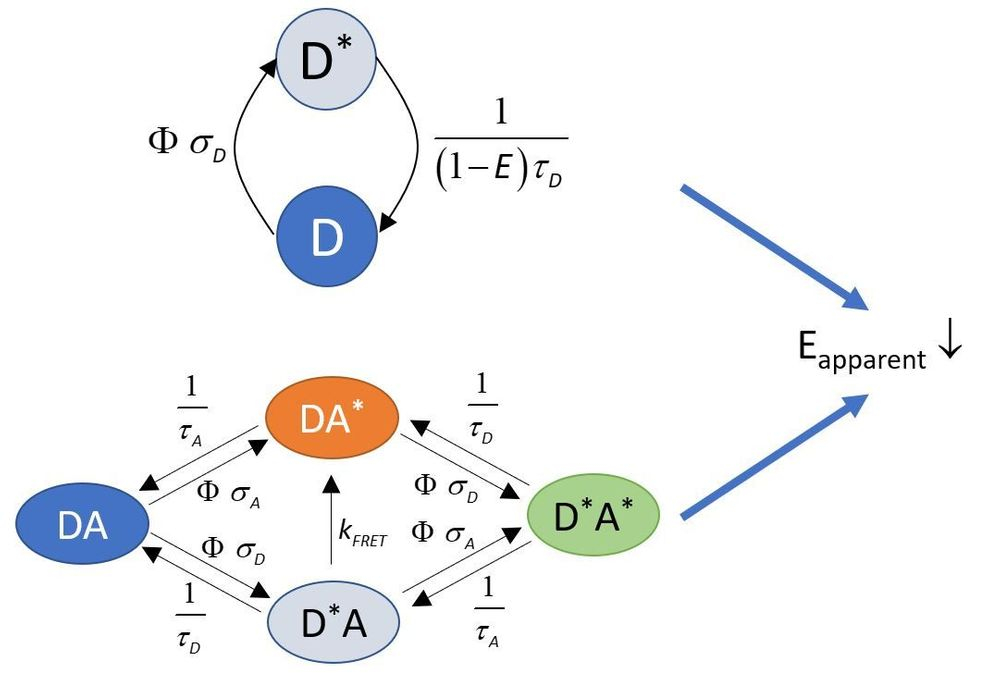
The problem arising on the donor side in the absence of the acceptor is briefly summarized in the scheme on the right. Due to fluorophore saturation the fluorescence intensity is not proportional to excitation intensity. This effect is quantitated by Dsat expressing the fraction of fluorophores in the excited state. Dsat can be converted to a form in which fluorophore saturation is compared to the saturation of enzymes expressed by the Michaelis-Menten constant. According to this comparison, a fluorophore is an enzyme converting excitation photons (substrate) to emitted photons (product).
When fluorophores are saturated, most of them are in the excited state breaking down the following "trivial" relationships:
These effects invalidate most approaches used for intensity-based FRET calculations. This is a serious issue since fluorophores are often saturated at commonly used excitation powers in confocal microscopy. We developed an approach for determining the FRET efficiency under such conditions. The method is described
If a donor-acceptor system in considered, donor saturation leads to an apparent decrease in the FRET efficiency calculated according to the conventional equation set.

The effect is also summarized in the cartoon below:
The consequences of fluorophore saturation on intensity-based FRET calculations are taken into consideration
R0 is the distance at which the FRET efficiency is 50% between a certain donor-acceptor pair. There are two applications available on my web site for calculating the R0 of a donor-acceptor pair.
You have to enter the donor emission spectrum and the acceptor absorption spectrum into columns B and C, respectively. If the absorption spectrum is normalized (which is the case for most spectra downloaded from the internet), you have to tick the "Absorption spectrum of acceptor is normalized" box, and provide a molar absorption coefficient at a certain wavelength (cells F11 and F14). Three more parameters must be specified (donor quantum yield in the absence of acceptor, index of refraction of the medium and the orientation factor). Then, press the "Calculate R0" button to calculate the overlap integral that will be displayed in nm units in cell H2.

The program, r0ForFRET, can be used in two different modes:

E.g.: [r0,j]=r0ForFret('n',1.4,'kappa2',2/3,'qd',0.8,'normalized','epsa',556,112000,'absa',abs,'fd',emiss,'wavelengthd',wld,'wavelengtha',wla)
Installation: download the r0ForFret.zip file, unzip it to a folder on your computer. This program is also available from the Matlab File Exchange.